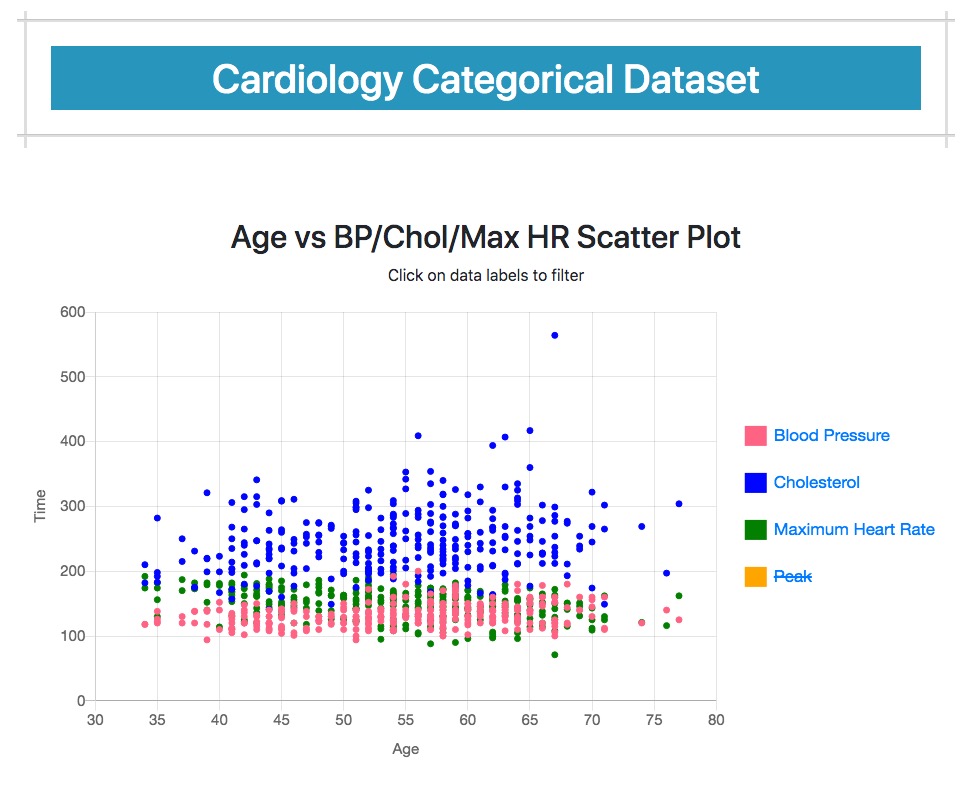
Data visualization is more important than ever due to the explosion of information available in all business models. The way the human brain processes information, using charts or graphs to visualize large amounts of complex data is easier than poring over spreadsheets or reports. Data visualization is a quick, easy way to convey concepts in a universal manner – and you can experiment with different scenarios by making slight adjustments.
This is a great tool. I love how simple it is to toggle data sets on and off. This is incredibly useful for our team and the public at large.

